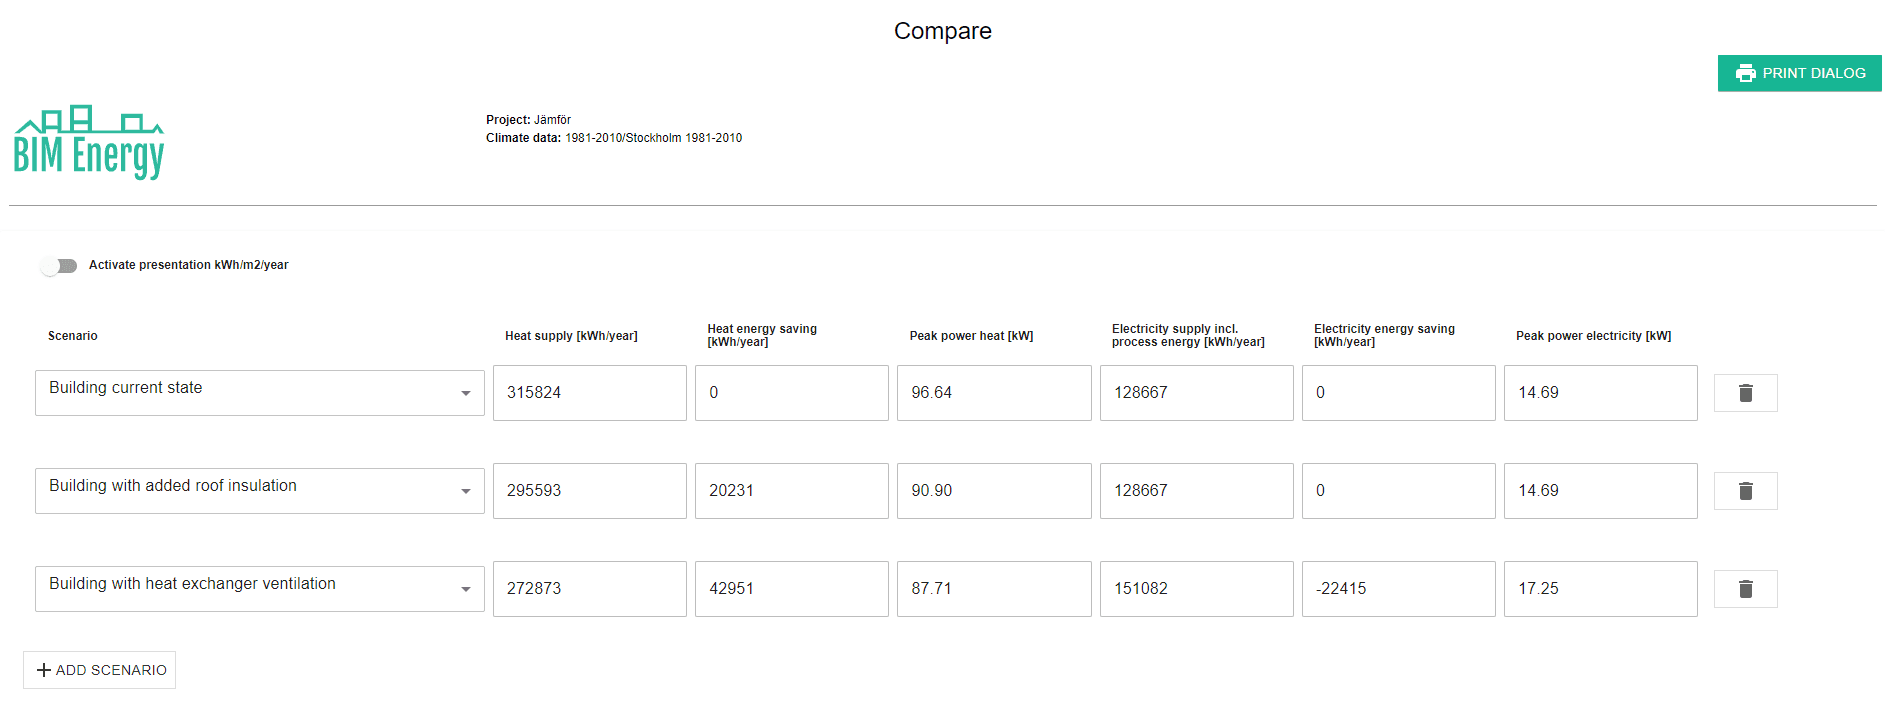
Evaluation: Compare
In the Compare step, the heat and electricity supply can be presented for all buildings in a project, together with the heat and electricity peak power. The energy saving between the alternatives of the reference building is calculated and presented. The energy can be presented as kWh/year or kWh/m2/year. Positive value is energy saving.
Peak power heat – Peak power of the heat supply indicators (hot tap water, heating system, ventilation)
Peak power electricity – Peak power of the Electricity use + Process energy (internal and external) indicators
To evaluate the profitability of the scenarios, pay off (year) and saving cost (SEK/kWh), see description below
Energy saving heat and electricity is calculated in comparison to the reference scenario. If the user does not actively choose which building should be the reference scenario, the first created building in the project is presented as the reference scenario.
Heat and electricity price is inserted for each scenario.
Investment cost, maintenance cost, life span and energy price increase are also inserted for each scenario. This presentation of the comparison between the buildings can be printed out or saved with Print dialog

